QuantumLeap X-ray Absorption Spectroscopy Results Gallery

High Resolution of Air Sensitive Electrodes
Air Sensitive Electrodes taken at 0.25 eV step sizes, sub-0.5 edge shift sensitivity
. The Fourier Transform shows one strong peak ~ 1.4 Å and weaker peaks from 2.5 Å (non-phase-shifted figure on the right)")
Fe K-Edge EXAFS & FT of 0.2% wt. sample
Fe K-Edge EXAFS & FT of 0.2% wt. sample taken till k=14 Å-1 (Figure left). The Fourier Transform shows one strong peak ~ 1.4 Å and weaker peaks from 2.5 Å (non-phase-shifted figure on the right)
 and Fe Foil")
XAS Sample 3 and Fe Foil
XAS Sample 3 (Very low loading concentration ~0.2 wt % fluorescence mode) and Fe Foil
 showing the Pd-P bond interaction and small multiple scattering contributions after that. For the Pd foil we see only one peak ~2.5 Å, showing the Pd-Pd interaction")
Pd K-Edge EXAFS and FT for Pd(PPh3)4 and Pd foil
The Fourier Transform for S7 shows one strong peak ~ 1.8 Å, (non-phase shifted) showing the Pd-P bond interaction and small multiple scattering contributions after that. For the Pd foil we see only one peak ~2.5 Å, showing the Pd-Pd interaction
 and the ratio of long bonds decreased (5.4 → 4.6).")
Biological Catalyst: Metal Organic Framework (MOF)
Mn K-Edge EXAFS FEFF fitting of the G-Mn-adp. Comparing model C-Mn-adp and FEFF fit with Mn-O shells. Results showed the population of short bonds increased (CN doubles, from 0.6 → 1.3) and the ratio of long bonds decreased (5.4 → 4.6).
 bond and a short Mn-O (1.9 Å) bond.")
Biological Catalyst: Metal Organic Framework (MOF)
Mn K-Edge EXAFS FEFF fitting of the C-Mn-adp. The fit shows the structure consists of a long Mn-O (2.11 Å) bond and a short Mn-O (1.9 Å) bond.
 and operating in fluorescence mode XAS. The Fourier transform magnitude of the EXAFS shows only one strong peak. The peak ~2.4 Å (non-phase shifted) shows the Ru-Ru bond.")
Ruthenium Powder Catalysts at ~20 keV
Results demonstrates the high energy performance for a laboratory XAS at >20 keV (high x-ray energies, which is difficult for lab XAS) and operating in fluorescence mode XAS. The Fourier transform magnitude of the EXAFS shows only one strong peak. The peak ~2.4 Å (non-phase shifted) shows the Ru-Ru bond.
 and the average Mn-O bond.")
Biological Catalyst: Metal Organic Framework (MOF)
Mn K-Edge EXAFS of C-Mn-adp and G-Mn-adp. Taken till k=15 Å-1 in Transmission mode, the Fourier Transform shows the first peak ~1.6 Å (non-phase shifted) and the average Mn-O bond.
.")
Reference Ruthenium Oxide at ~20 keV
FEFF results performed from FIRST shell fit of Ru-O. Results show average Ru-O distance @ 1.96 Å with a coordination of N=6 (fixed).
 show the Ru-O bond and peaks at ~2.7 Å and ~3.2 Å show the Ru-O-Ru bond consistent with the literature.")
Reference Ruthenium Oxide at ~20 keV
The peak ~1.5 Å (non-phase shifted) show the Ru-O bond and peaks at ~2.7 Å and ~3.2 Å show the Ru-O-Ru bond consistent with the literature.

Operando NCM EXAFS tracking speciation of Ni (3-4.5V)
An operando cycling experiment was performed between 3-4.5V cutoff on NMC cathode through EXAFS to investigate the Ni-O and Ni-M environment,

First Operando Laboratory XAS Study of in-operando battery
The operando battery was analyzed during a single charge cycle, demonstrating synchrotron quality and precision of data. Results highlight operando tracking of Ni redox in NMC Li-ion battery electrode till 4.5 V cut-off.
 on similar WiO3/TiO2 system. The results from H2000 are consistent with the published results showing the first strong W-O bond and the peaks from 2-4 Å arising from the W-M bonds.")
Comparison of W LIII-edge EXAFS and FT WO3/TiO2
The FT EXAFS was compared with the previous W L-edge published works (Yamazoe et al. and Baia et al. on the right) on similar WiO3/TiO2 system. The results from H2000 are consistent with the published results showing the first strong W-O bond and the peaks from 2-4 Å arising from the W-M bonds.
 and the XANES regions (upper right) are shown above. The XAS W-L3 spectra shows similar features earlier reported by Baia et al. shown on the right (below), for a similar system")
W-LIII -Edge XANES Data for WO3/TiO2 sample
Study collected XAS spectra (left) and the XANES regions (upper right) are shown above. The XAS W-L3 spectra shows similar features earlier reported by Baia et al. shown on the right (below), for a similar system
 and longer (2.24 Å) bond. Fe-P has average CN of ~5 with shorter (2.83 Å) and longer (3.25 Å) bond.")
Fe K-Edge EXAFS FFFF fitting of the LFP (LiFePO4) electrode
EXAFS fit performed using 4 shells: 2 for Fe-O and 2 for Fe-P. For each case, one was a shorter and one was a longer bond. Native crystal structure of LiFePO4 was taken from crystal structure database. Results showed Fe-O has average CN of ~6 with shorter (2.06 Å) and longer (2.24 Å) bond. Fe-P has average CN of ~5 with shorter (2.83 Å) and longer (3.25 Å) bond.
. Fourier transform (right) shows one strong peak at ~1.6 Å (Fe-O), a second peak ~2.6 Å (Fe-P), and a weaker peak ~3.4 Å.")
Fe K-Edge EXAFS and FT for LFP (LiFePO4) electrode
Results shows EXAFS processed for k=13.5 Å-1 (left). Fourier transform (right) shows one strong peak at ~1.6 Å (Fe-O), a second peak ~2.6 Å (Fe-P), and a weaker peak ~3.4 Å.
 shows a coordination N = 1.2 and the Pt-Pt (purple line) showed an N =5.5. Pt-N bond was 2.03 Å and the Pt-Pt bond was 2.71 Å")
Hydrogen Generation (Fuel Cell) Catalysts
EXAFS FEFF Fitting of Pt-hBN Catalysts. The Pt-N (golden line) shows a coordination N = 1.2 and the Pt-Pt (purple line) showed an N =5.5. Pt-N bond was 2.03 Å and the Pt-Pt bond was 2.71 Å
 is the most oxidized and Sample #1 (S1S1) is in the most reduced form. (Figure on the right and left). This corresponds to a ~0.7 oxidation change between S1S1 and S1S2.")
Co Speciation in Challenging (Low Co) Li-Ion Cathode
Isosbestic points seen in NCM Co K-edge XANES. XANES shows that sample #2 (S1S2) is the most oxidized and Sample #1 (S1S1) is in the most reduced form. (Figure on the right and left). This corresponds to a ~0.7 oxidation change between S1S1 and S1S2.

XANES Comparison of NMC 622 Battery
Ni K-edge of NMC 622 battery, acquired at Pohang Light Source and Sigray QuantumLeap
, showing the power of Sigray QuantumLeap for high energy fluorescence-mode EXAFS measurements. Data was acquired at 3 hours (Ru powder), 4 hours (RuO2), and 4.5 hours (RuP)")
Ru K-edge f-mode EXAFS at 22 keV
Various Ru formulations taken at the K-edge (22 keV), showing the power of Sigray QuantumLeap for high energy fluorescence-mode EXAFS measurements. Data was acquired at 3 hours (Ru powder), 4 hours (RuO2), and 4.5 hours (RuP)
.")
Ru-fluorescence
FEFF fit of Ru power fluorescence EXAFS results acquired in 3 hours - showing two Ru-Ru paths (2.69A and 3.04A).
 and S1S2 (most oxidized). S1S3 and S1S4 were comprised of the two distinct species.
More information is found in our Apps Note (email sales@sigray.com to receive a copy).")
Co Isosbestic Points
Isosbestic points seen in Co K-edge for four different samples. A Least Squares Linear Combination Fitting was performed on the spectra which indicated two distinct species: S1S1 (most reduced) and S1S2 (most oxidized). S1S3 and S1S4 were comprised of the two distinct species.
More information is found in our Apps Note (email [email protected] to receive a copy).

Pt-hBN
comparison of the XANES of the Pt-hBN with the Pt foil shows that the Pt-species in Pt-hBN is an oxidized species compared to the Pt-foil, as the Pt-L3 edge moves to higher energy for the Pt-hBN catalyst sample. Acquired in 3 hours for Pt-foil.
 of ~1.2 and Pt-Pt CN as ~5.5. Both oxidized and reduced versions of Ni were found present in the results. Shown is the Pt-BN Catalyst in R space.")
Hydrogen Generation Pt Catalyst
Sigray QuantumLeap provides high signal-to-noise EXAFS results on a Pt-BN catalyst with <2% wt in fluorescence-mode. Pt. Results show Pt-N bonding with coordination number (CN) of ~1.2 and Pt-Pt CN as ~5.5. Both oxidized and reduced versions of Ni were found present in the results. Shown is the Pt-BN Catalyst in R space.
 was low in the NMC battery samples, which were Ni-dominant. Analysis of the EXAFS shows that there are slightly longer bond lengths in the charged sample. Further, the XANES region shows that the Co in the discharged sample is reduced. Collected on QuantumLeap-H2000 using Ge-311 Johansson crystal.")
Fluorescence EXAFS of Co in NMC Samples
Fluorescence geometry EXAFS of Co in NMC Samples. Co (~3-5wt%) was low in the NMC battery samples, which were Ni-dominant. Analysis of the EXAFS shows that there are slightly longer bond lengths in the charged sample. Further, the XANES region shows that the Co in the discharged sample is reduced. Collected on QuantumLeap-H2000 using Ge-311 Johansson crystal.
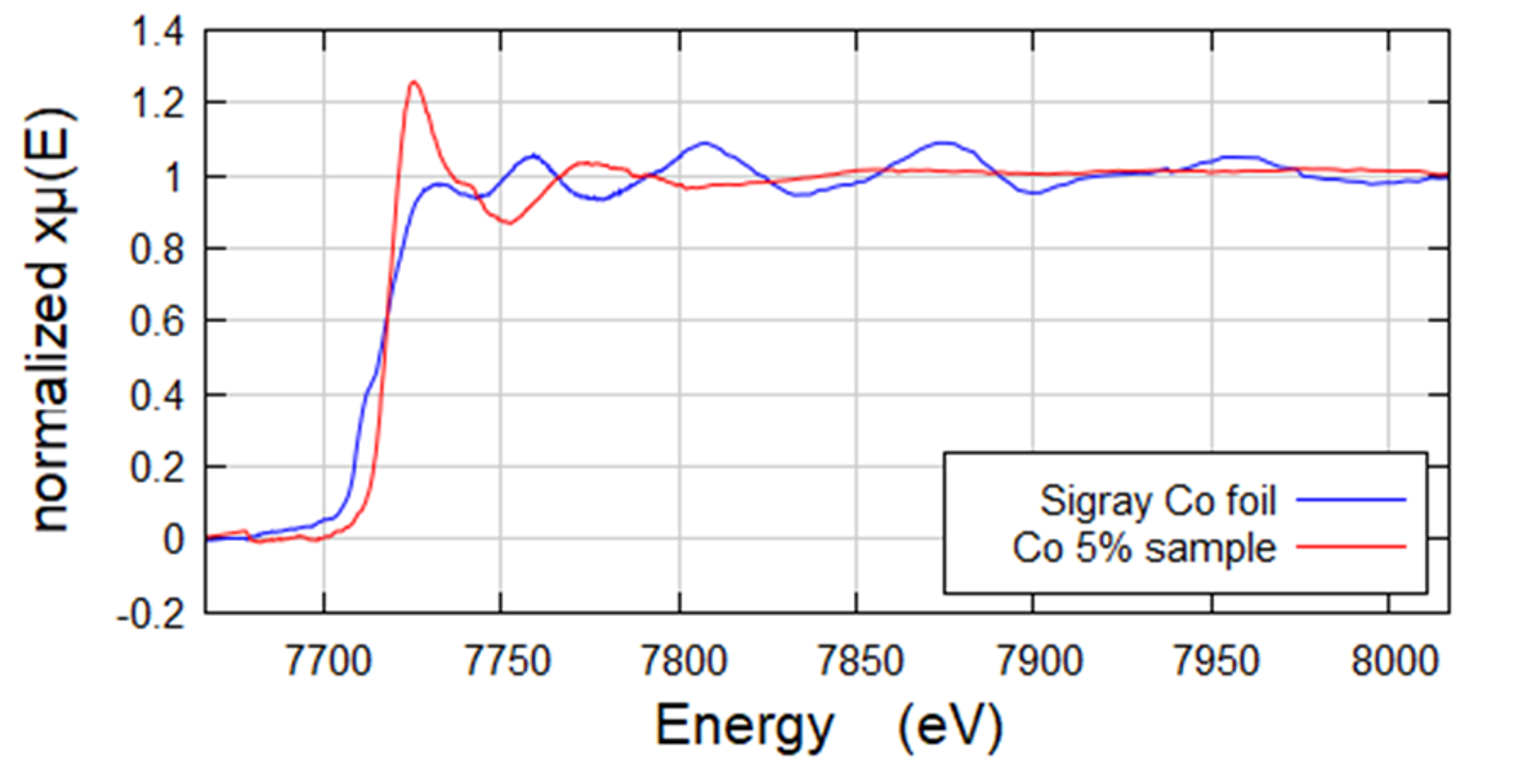
5pct-Co
.")
Zirconium foil
K-edge of Zirconium foil at its absorption K-edge of ~18 keV. QuantumLeap H2000 is uniquely capable of K edges of high Z elements (up to 25 keV).
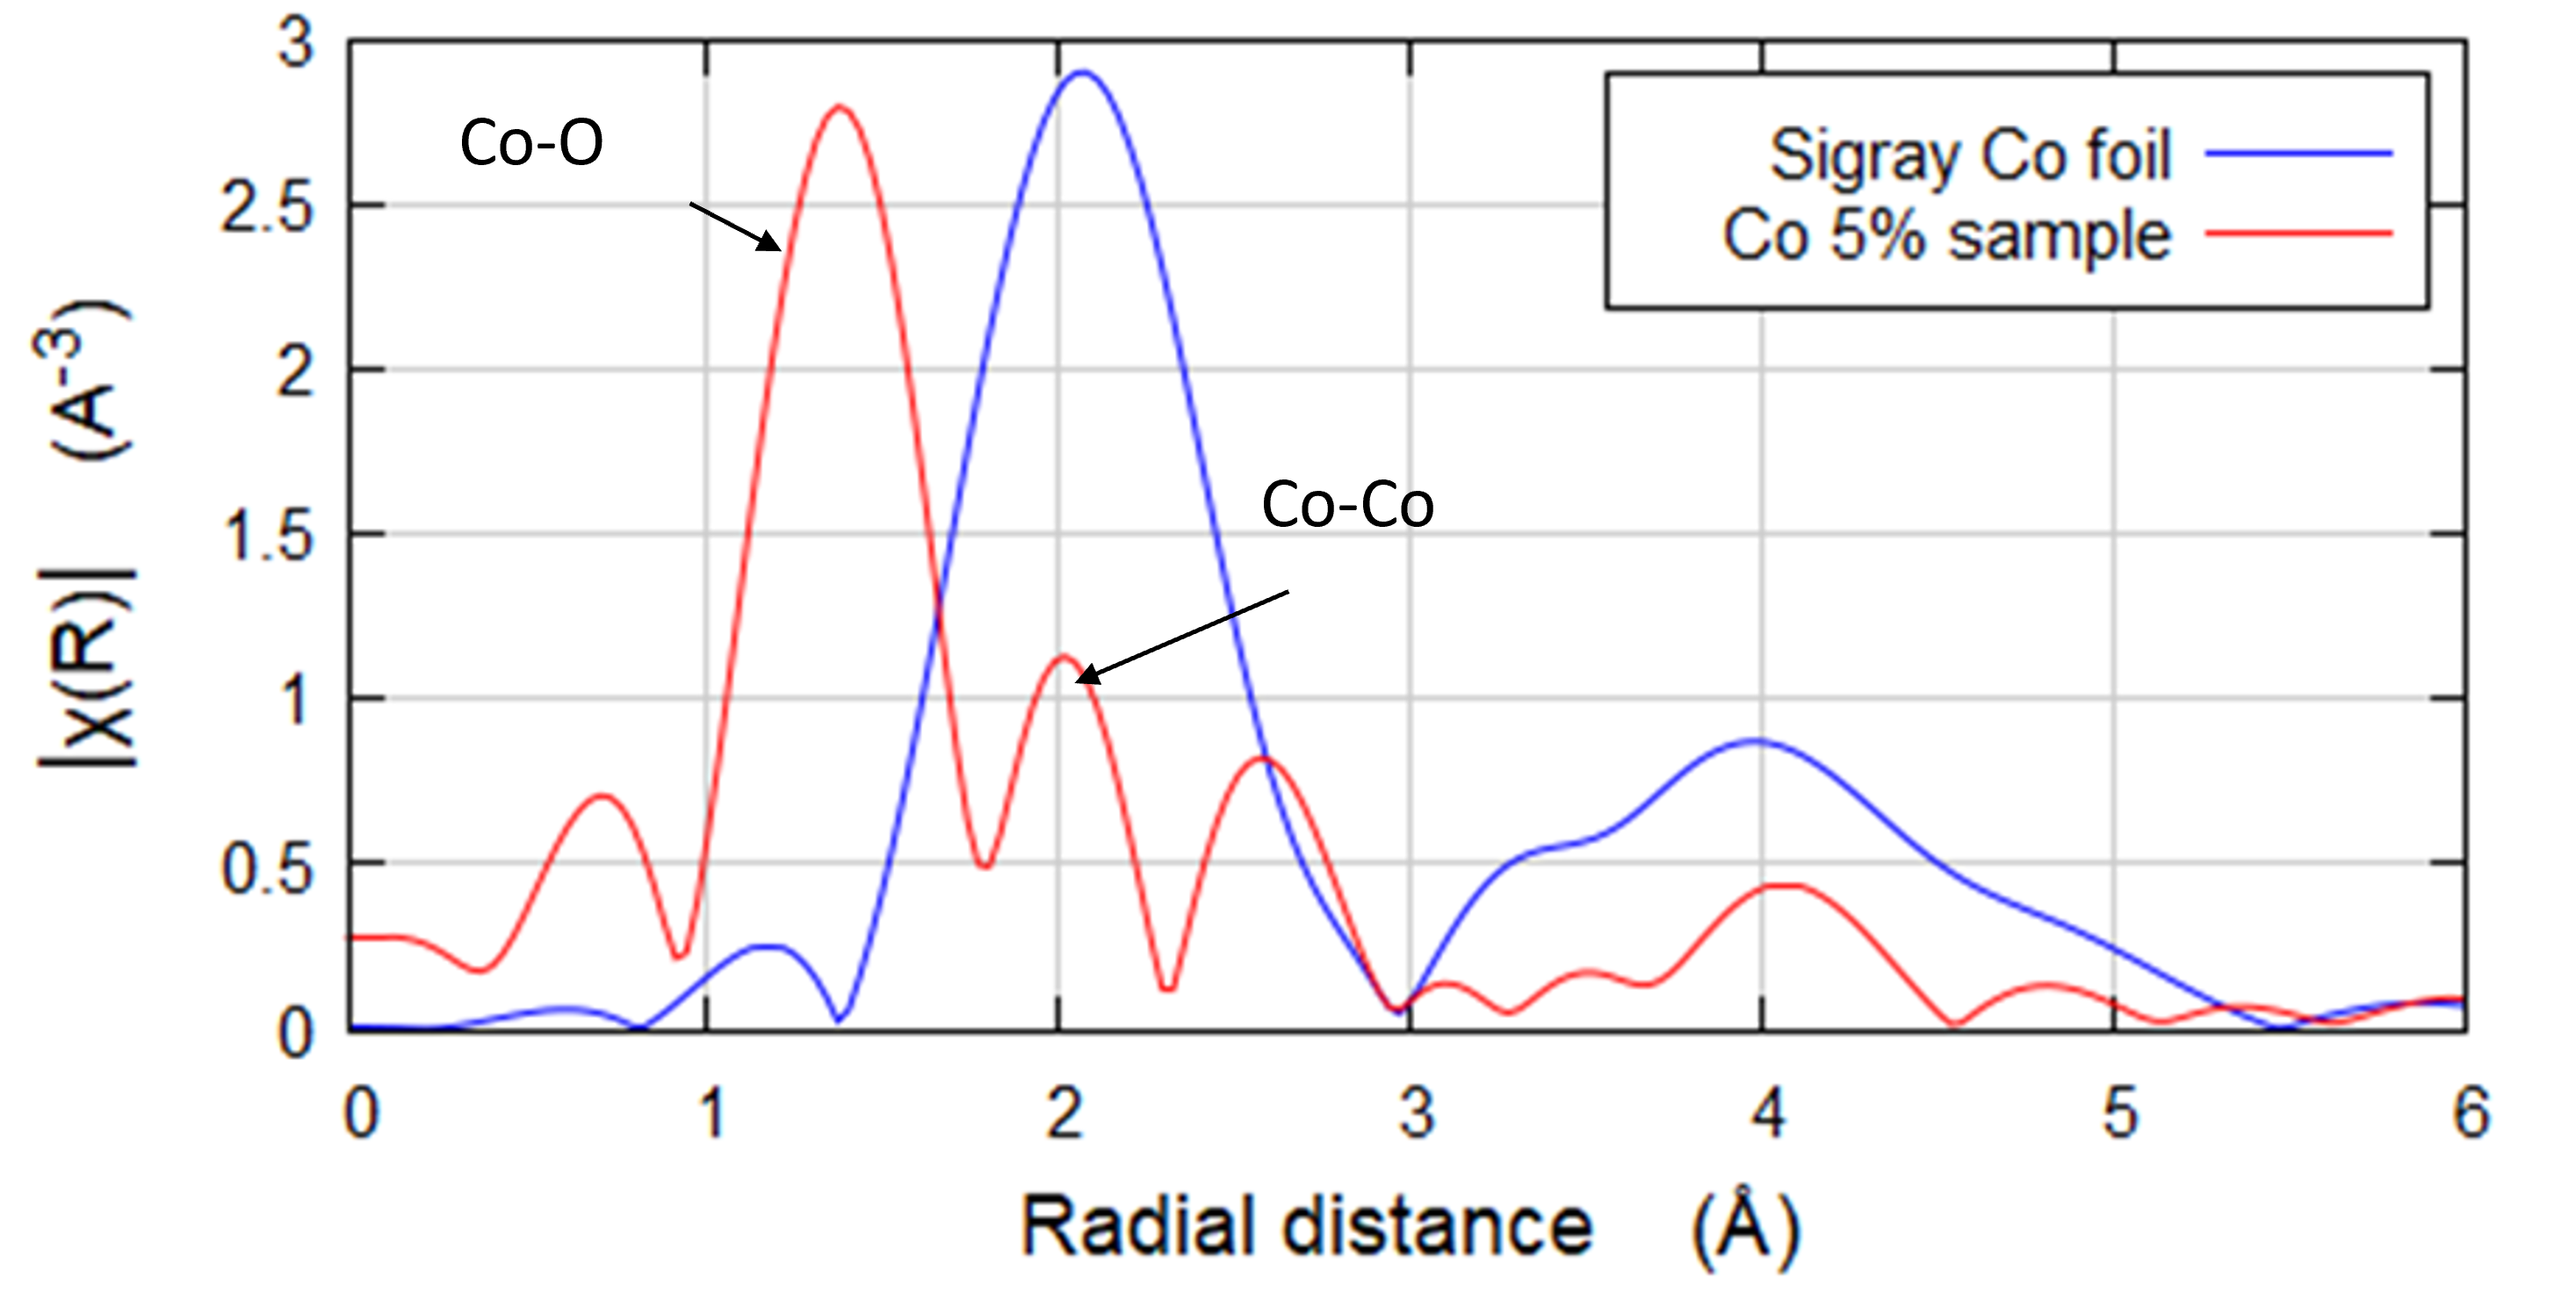
5pct-Co-analysis

Ni Foil to high K Space
Nickel foil reference taken to demonstrate high SNR to high k-space on QuantumLeap

Pre-edge peaks in Rutile
High energy resolution of QuantumLeap used to resolve three pre-edge peaks of Rutile samples.

NMC K-edges XANES
Mn oxidation states in NMC batteries, compared with standards of Mn and MnO2.
 and the high concentration of Ni prevented these two NMC samples from being successfully imaged standard transmission mode XAS. Acquired using Ge-311 cylindrically curved Johansson crystal. Edge shows shift in the discharged versus charged samples.")
Mn in Ni-dominant NMC Battery Sample
Mn edge acquired in fluorescence geometry XAS on QuantumLeap H2000. The low concentration of Mn (2%) and the high concentration of Ni prevented these two NMC samples from being successfully imaged standard transmission mode XAS. Acquired using Ge-311 cylindrically curved Johansson crystal. Edge shows shift in the discharged versus charged samples.
Contact Us
If you have a sample that is not represented by the images above and need it to be scanned, we provide complimentary demonstrations for budget acquisitions. Fill out the form below.